Boosted Traffic 583% with a Tailored SEO Strategy
583%
increase in organic traffic
363%
increase in keywords ranking in top 100
Sending your data to our servers, please wait...


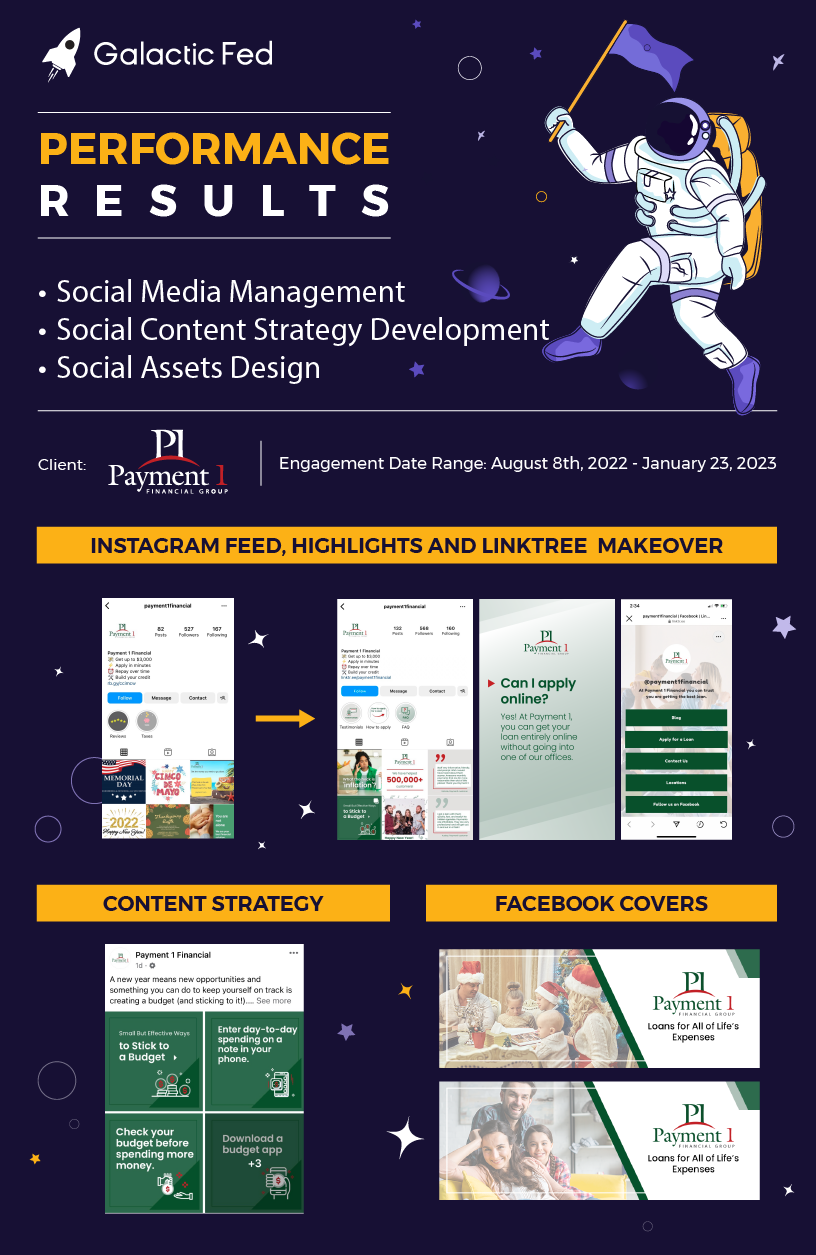
Payment 1 is a loan company in Texas and New Mexico specializing in personal loans, auto loans, and tax refund advances. They also allow customers to get loans online without ever having to go into a physical branch.
They used to employ social media channels to educate and support their clients but hadn’t posted in a while. The Galactic Fed Creative Studio team was brought on board to revive Payment 1’s social media presence.
The team began with a complete makeover of the brand’s social channels on Instagram and Facebook, as old designs didn’t reflect Payment 1’s visual identity guidelines. Galactic Fed created new banners, Highlights icons, post templates, and linktree design.
Simultaneously, the Creative Studio started to work on the content - strategizing different content pillars and finding topics that would bring value to the consumers in a fun, social media way.
Over the course of 5 months, Galactic Fed tested multiple designs, formats, types of posts, hashtags, and schedules to see what works best for the brand and prepare recommendations for future organic growth on social media.
After a few weeks of regular posting, Payment 1 accounts began seeing increased organic engagement from existing followers, which continues to grow MoM.


increase in organic traffic
increase in keywords ranking in top 100
Increased CTR
Qualified Leads
Average CVR increase
Average decrease in CAC
increase in purchases
increase in revenue
increase in referring domains
increase in organic traffic
increase in top ranking keywords
increase in backlinks
increase in top 100 ranking keywords
increase in backlinks
increase in referring domains
increase in organic traffic growth
increase in leads
average CTR
Open rate of email marketing campaign
Increased leads
increase in referring domains
increase in backlinks
increase in organic traffic
increase in referring domains
increase in backlinks
increase in impressions
increase in CTR
conversions
increase in organic traffic
increase in top 10 keywords
increase in sales revenue
increase in sales from ads
increase in sales revenue
increase in sales from ads
increase in page views
decrease in bounce rate
increase in organic traffic
increase in referring pages
increase in organic traffic
increase in referring domains
increase in site traffic
increase in revenue
increase in clicks
increase in impressions
increase in MQL volume
decrease in cost per lead
decrease in CPA
increase in clicks
increase in referring domains
increase in ranking keywords
increase in trials (Q1)
decrease in cost-per-trial (Q1)
overall decrease in cost-per-trial
decrease in cost-per-mile
of the wailist converted into users
increase in retention and user engagement rates
increase in non-branded impressions
increase in referring domains
increase in referring pages
in domain rating
increase in referring domains
increase in top 100 keyword ranking
increase in referring pages (Ahrefs)
increase in organic traffic (Ahrefs)
increase in time on page
decrease in bounce rate
Average CPC
Users
decrease in CPT
increase in CTR
decrease in CPC
decrease in CPM
increase in organic traffic
increase in keyword ranking
increase in referring domains
increase in non-branded impressions
increase in engaged organic sessions
increase in impressions
increase in all clicks
increase in referring domains
open rate
clicks per unique open
emails sent
click rate
increase in referring domains
increase in organic keywords ranking
increase in organic traffic
increase in referring pages
conversion rate
QoQ growth in the number of leads
Cost Per Lead
increase in activation rate
increase in referring pages
increase in organic keywords ranking
increase in referring domains
increase in organic traffic (Ahrefs)
Clicks to the website
Brand-new subscribers in three markets
Leads Generated
Impressions garnered
add-to-carts
increase in website traffic
increase in purchases
decrease in cost-per-purchase
decrease in Cost per QL
increase in converion rate
decrease in CAC
increase in click-through rate
increase in conversion rate
impressions
decrease in CPL
increase in referring domains
increase in branded clicks
increase in branded impressions
increase in non-branded impressions
decrease in cost-per-order submitted
decrease in cost-per-click
increase in submitted orders
increase in Quality Score
average open rate
max conversion rate
conversion rate on customer win-back series
in-app conversions from notifications
increase in non-branded clicks
increase in organic keywords
increase in non-branded impressions
backlinks built and acquired from unique referring domains
increase in organic keywords ranking
increase in referring domains
increase in organic traffic
increase in non-branded clicks


Please try a different search phrase.